Histograms: 255 Shades of Gray
Histograms may not actually be sexy, but they are highly useful tools from the beginning to the end of the photographic process. Taking a few minutes to learn how to read a histogram will go a long way toward easing your workflow and improving your images overall.
What is a Histogram?
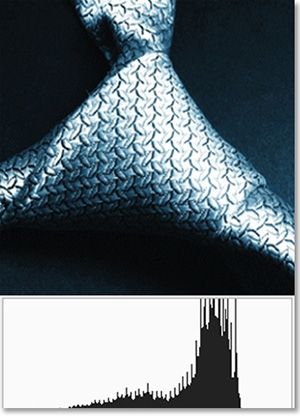
A histogram is a graph that shows the density of pixels within a range of brightness. To the left is black which has a value of “0”. On the right is white with a value of “255”. Everything in between is a shade of gray. The value “128” is 50% gray.
How to Read a Histogram
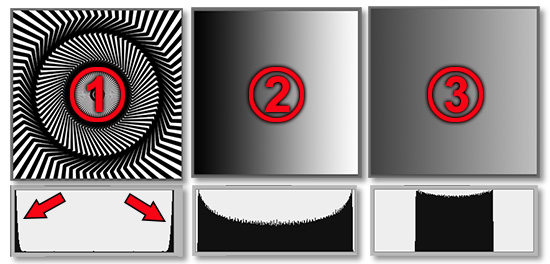
Image 1 is black and white with almost no gray. You can see the area in the middle is virtually empty, but both ends spike at the far ends.
Image 2 is a black-to-white gradient which is nearly equal throughout the image. You can see that, except for a small spike at each end, the density of the 255 shades of gray is nearly equal.
Image 3 has had the blacks and whites clipped and only contains the mid-gray tones. The areas that represent the black and white shades are empty, while the middle area of the graph is dense.
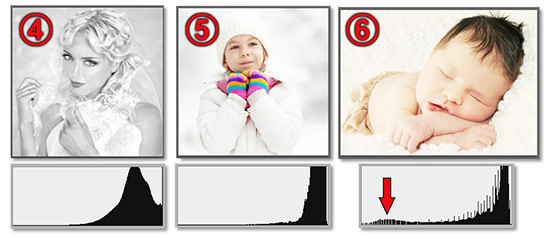
Images 4,5 and 6 are high-key images. Their histograms are sloped high to the right. Note the little blip in image 6 that represents the baby’s darker hair.
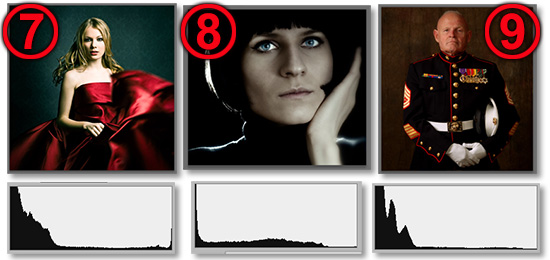
Images 7, 8 and 9 are low-key images. Their histograms are lop-sided to the left.
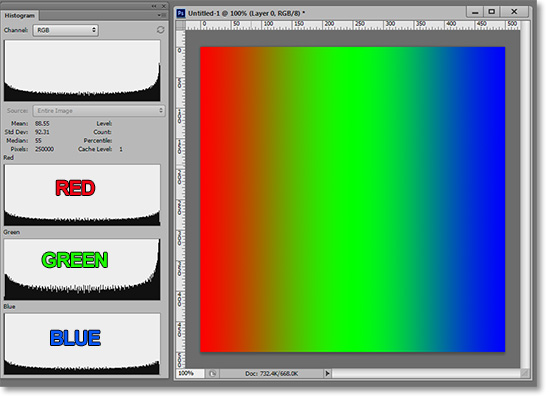
Color Histograms
In this case, we are using an RGB color profile which stands for Red, Green and Blue. Without getting into color profiles too much, this is likely the profile you will use the vast majority of the time. Each of these three colors has its own histogram that represents the brightness range of that particular color. Each color is considered a channel. If you keep up with our articles, you will be familiar with color channels by this time next week.
Practical Uses for Histograms
Almost all recently manufactured cameras have a histogram available to view either in the image review or in Live View while shooting your image. You can see the histogram while taking a picture and know if the image is properly exposed.
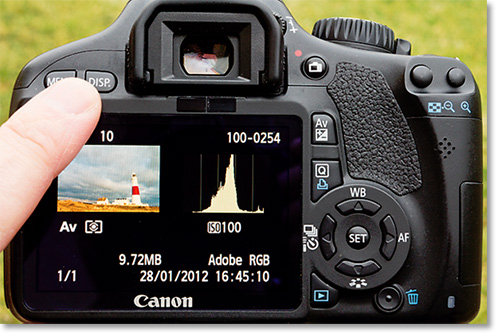
A broad mountain-like graph is generally considered to represent the best image exposure. However, there are many variables that could make that rule invalid.
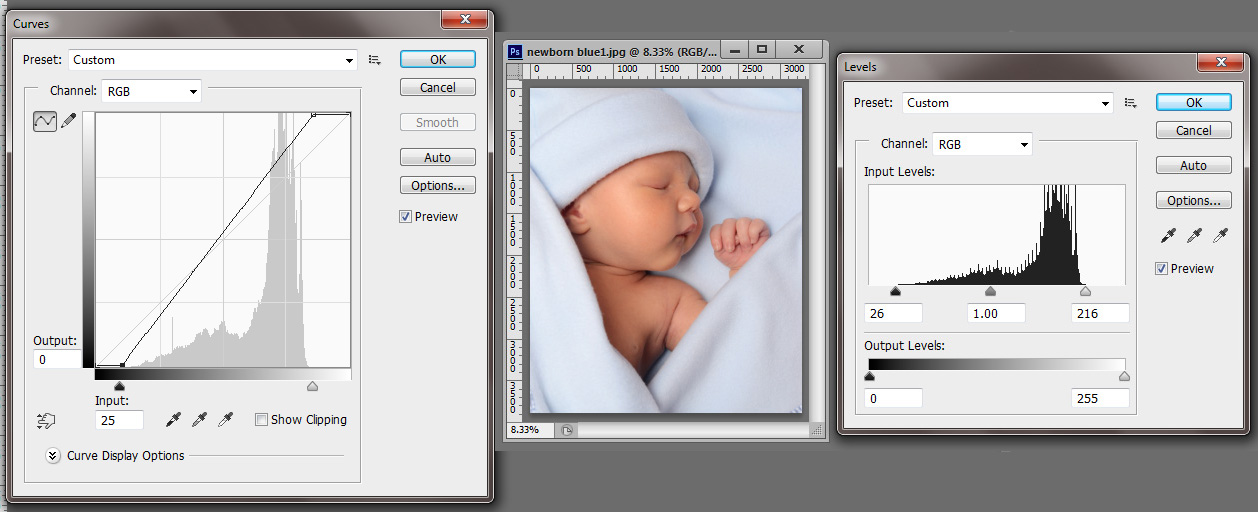
Histograms can be adjusted directly two main ways. You can either use the Levels adjustment (Ctrl+L) or the Curves Adjustment (Ctrl+M). The Levels are a bit easier to comprehend for beginners. But as you advance in skill, Curves are more versatile.
In the image below, you can see the same adjustments made with both Levels and Curves. The arrows show the relevant sliders to adjust to increase contrast.
Those are the basic concepts of the histogram. Its main functions are adjusting exposure and contrast, but with the proper knowledge and skill you can create many effects by manipulating histograms.
We will also soon be covering editing with Levels and Curves as well as other essential adjustments in future articles.
Stay updated with all our new releases and articles by signing up for our free email updates. We only send emails once a week to keep you updated and we NEVER spam or share your information. We’ve got that catchlight brush series and tutorials coming up as well.
If you enjoyed this article, get email free updates
Article Takeaways
1. Histograms measure the density of pixels within a range of brightness
2. White is "0", black is "255", and "128" is 50% gray.
3. The perfect exposure would look like a black hill within the histogram graph. There are many exceptions to that rule.
4. There are also histograms of the base colors within an image.
5. Many cameras have histograms in their Live View and/or image review.
6. The two main ways of directly manipulating a histogram in Photoshop are via Levels or Curves adjustments.